
by William Dickerson.png)
Have you ever completed a job and thought, "Wow I really should have done x, or if I had done y, this may not have gone wrong?"
Well, at least in some of those cases, At the Ready is here to help - as Benjamin Franklin once said, "By failing to prepare, you are preparing to fail." (Or perhaps such a geeky subject of technology warrants one by J.R.R. Tolkien whom wrote "It does not do to leave a live dragon out of your calculations, if you live near him." And in this case, the dragon may be you or yours.)
Where we as humans may fail at this, technology can support us to make the fall less short, the impact scope less wide, or the negative connotations even non-existent. Our pursuit here is using the tools of Google Maps and/or Google Earth to assist us in our First Response capabilities by any means necessary. We could use either tool to visually make a case for acquisitions, in optimizing routes to the scene of an event, in communicating the quantity and severity of events in a location, our own coverage areas for reporting to local/national governments, analyzing a past incident for legal purposes, future prevention, or simply recording the data in a more "munch-able" format, if you will. The list is surely only limited by our imagination as the tool is not the end, but the speed of the means.
We'll start with an extremely basic example to get us started and, in the future, we at At the Ready will provide more in-depth tutorials to solidify the operational base we'll be laying out with you today.
This time we'll be using Google Earth to tag places on a map, showing you how to create a presentable tour based on that data, and how to save this information for others.
What is Google Earth, you say?
Google Earth is, quite simply, a program that uses satellite imagery of the Earth for mapping information that can be enhanced with images, meta-data, location tag points, geometry, data overlays, and other more advanced programming-oriented ways to include information.
Here's a functional overview of the program to elaborate on that point - https://support.google.com/earth/answer/176145?hl=en&ref_topic=4363013
How does it work?
Google Earth uses an extremely powerful underlying code that can enhance the basic satellite images with a rich amount of data for collaboration, presentation, recording, and education. The information can be anything from simple place markers, adding basic labels, custom iconography, to overlaying images on the information, color-coded data overlays with complex annotations, and even yet more-complex code that takes those basic markers and applies animations or contextual actions.
The help files provide more information on the capabilities and can be coupled with the At the Ready tutorial series. You can browse those here.
So, what do I do with it?
As an analogy for Google Earth as a tool, you can write a sentence with it, or you can write a 3000 page novel with full leather-binding and illumination selling for $1,000,000 a pop that changes the world as we know it forever - all the tools are provided and need only you to use them.
Using this in conjunction with your known data of disasters, crimes, injuries, fires, and so on, you will be able to give a visual demonstration of the climate in your area as it pertains to your future response. We could, for example, analyze how destructive a fire was in the area by tagging the destroyed locations with colored overlays to show the level of damage. This assists us in calculating the impact of the response and places for improvement in methodology. We can then apply metadata to those colored overlays which provide the exact address, the percentage of the home destroyed, estimated monetary loss, any casualties caused, responders involved, time of destruction, cause of the fire, and anything else you can think to tag and organize the components with.
If you get more involved, then you can tag all your known incidents in a given time frame. We could then create affectation regions which take each of those tags, apply a circular area with some degree of transparency. You'd find that as you tag more locations, the scene coalesces into a colored region on the map that shows where you need to focus your attention in terms of preventing fire, crime, injury, or whatever other information you may be tracking.
This information could then be provided to local residents to warn them of danger via Public Service Announcements/Campaigns, be used to help acquire additional funding to focus efforts on the area, demonstrate team effectiveness during reviews, or even more precise things like determining the catalyst for high rates of incident or low rates of prevention/success. For example, perhaps more buildings are lost in a specific area which you can then apply a traffic overlay to and find that the traditional route to an area may no longer be the fastest and, in fact, may be the very cause for the loss of those buildings altogether. We can then re-analyze our route, increasing response time and allowing units to arrive and drop the loss case numbers a notch or two. The most likely area the information might be used to maximum effect is in mutual aid scenarios to improve/provide coverage to areas that need it the most. Especially in cases where a responder from the next county over won't have the same years/decades of street smarts you or your department might have.
Now at this point some may be thinking that this is all fancy computer business that should be done by programmers and data harvesters hiding in caverns, far from society, their coke-bottle glasses dimly lit by the glow of the computer screen. However, before we begin with wailing and gnashing of teeth at the thought, I'll tell you it's nothing of the sort! Easy enough, it's all point and click, type in some things, change a few settings, and you're ready to go. If you, like your Web Developer here at At the Ready want to hide in a cavern then, hey, you're free to do so and follow along with the Advanced Tutorials soon to come - we'll leave the light on for you.
So, have we sold you yet? Yes? Excellent!
Let's Get Started
Install
Accept the terms of service and download it here and we'll get started with giving you some real ways to use it.
Getting Acquainted
The most basic functions can be completed by any user without much effort. Once the program is open, we just enter a location in the top left input box where it says search, then press enter or click search to go to it. This can be a city, a country, a general location, a zip code, a street address, place of business, etc.
You can navigate with the mouse wheel, use the controls on the right side to change the camera angle, rotate it, zoom in, and so on.
Help documents, if you prefer to read them first:
Searching and Other Basic Functions
Basic Data Plotting and Help
More Advanced Ways to View Things
Settings, What They Do and How to Change Them
Download the File for This Tutorial
Click here to download the .KMZ file which you can then open in Google Earth and see the tour and everything else we'll be doing here. To just take the tour, double-click the tour on the left in "My Places."
Plotting Some Data - Part I., the Easy Bit
Now that we have the program, know how to find a location and move the Camera around, we can put in some info to start getting our data visualized.
In theory, you should have access to the data for past issues in your area as it pertains to your own type of First Responder, or for your division as Emergency Management, of course. I, not having such access, will utilize online repositories with past data to provide my examples. Don't worry, I'll be providing my process as well, just to make sure we see eye-to-eye.
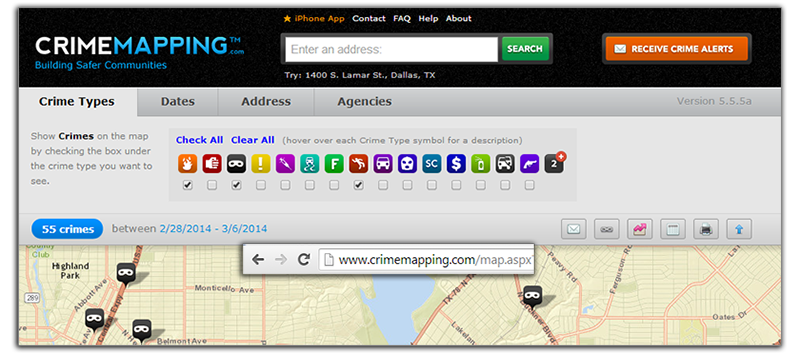
I used the website http://www.CrimeMapping.com which will provide me some real information to map and create a scenario which should give you a bit of a demo on what we can achieve with it.
The specific area will be the Dallas, Texas crime map - honestly, for no better reason than that I'm from Texas and miss the barbeque. The map is, sadly, very well populated - sorry, Dallas.
Have a quick look around, navigating to show only burglaries, arson, homicide, or whatever other data you may be interested in. Don't worry, I'll wait here while you do that. Just remember that our most basic tutorial will be similar to this while our more advanced tutorials should blow this straight out of the water.
Done? Excellent! Let's harvest the data so we have something to work with. Feel free to use your own if you have it handy, of course.
• To start, I've minimized it to Burglaries and Homicides, both of which might result in the need for multiple Responder types to be on-scene
• I've further minimized the information to just 2 days of data so we can get a decent sample set without data-overload
• Do this by clicking the tabs at the top for Crime Types and Dates, respectively
• Harvest CrimeMapping.com's info by clicking the Detailed Report button in the toolbar
• It looks kind of like a Calendar, if that helps
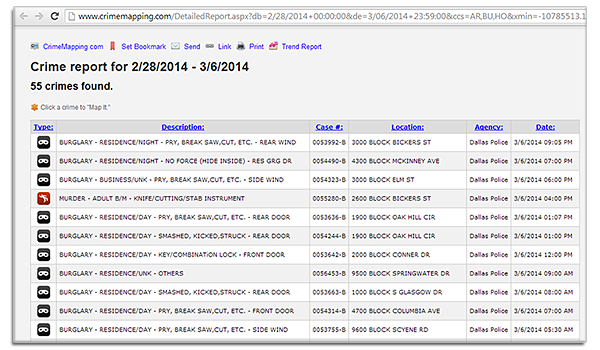
We can then start entering data, I'll do mine in order since I don't have a specific presentation to make.
• I clicked the word Location in the headers so it organized them with the lowest number address first, and largest last
• Highlighted and copied the address on the webpage
• Mine was 1000 Stonewall Street
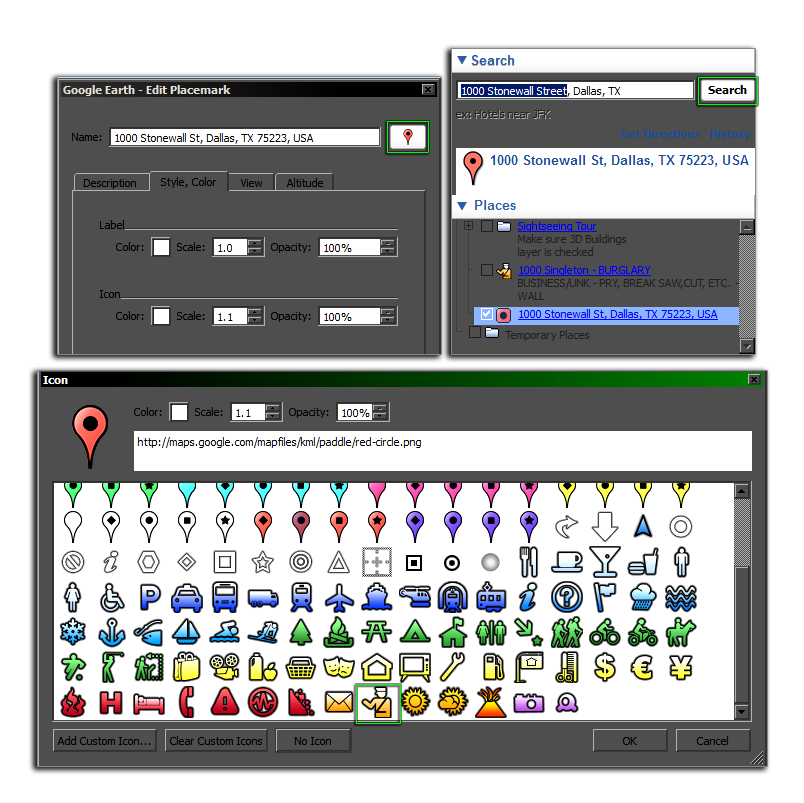
• Took that to Google Earth and pasted it in the search bar at the top-left
• Clicked the choice in Dallas, since there were multiple
• Then pressed enter to be taken to the location
Once it takes us there on the map, it automatically adds it as a location under the place we pasted it to be searched. It doesn't save it however, just remembers it for the moment.
• Right-click that and choose "Add to My Places" in order to save it
• It will then appear in the box below that for "My Places"
• This is your list of places you've saved
• Now they can be provided as a file to be given to others, made into a tour or image, or otherwise have effects applied to them which we can cover later
Did you need just one place to show to someone? Guess what, you're done!
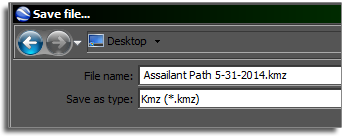
Just save it as an image from the top toolbar, save it as a .KML to have someone be able to load it in Google Earth, or email it off to someone. That was easy!
If not, let's get slightly more technical by reading on, intrepid adventurer.
Plotting Some Data - Part II., the Slightly-Less Easy Bit
• Now that we have it in "My Places," we'll right-click the street address we placed inside it
• 1000 Stonewall Street
• Choose properties at the bottom
• Here we get a smaller window with lots of information we can set or visual changes to be made
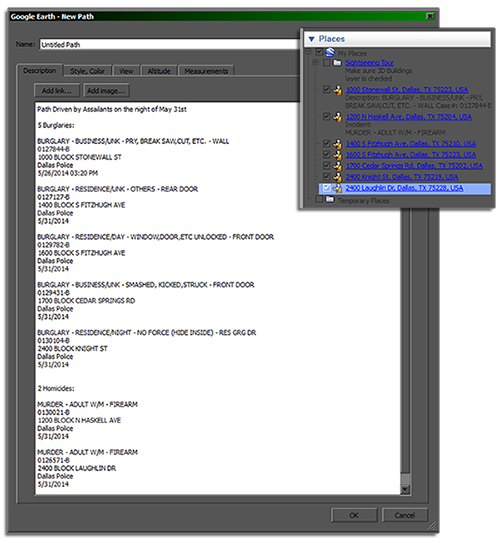
Descriptions
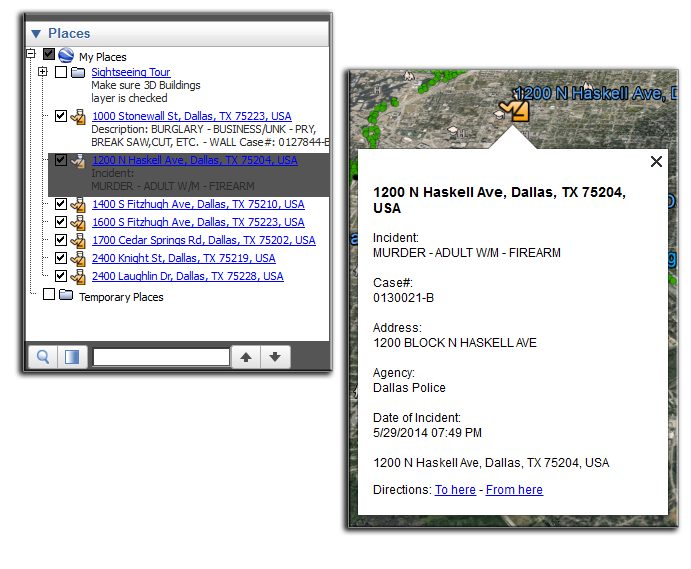
• Within the properties window, we can take the data from the webpage and use it as a description
• For example, that it was a burglary with the specified means of breaking in
• Provide as much or as little data as you like here depending upon the purposing of the file
• Add in the further metadata for the date of the incident from CrimeMapping.com
• Agency handling the issue
• Case number
• Date
• Etc.
• If needed, click the Add Link button if we have a webpage that has more information
• In my case, I provided the CrimeMapping.com webpage link that housed the detailed list we retrieved earlier
Icon
• Google Earth, already prepared to handle uses like these, has icons for Police, Fire, and Hospitals
• We can also make our own custom icons in case we need more precise indicators
• Being a Law Enforcement issue primarily, we can click the small icon to the right of the place name in the small window
• Then choose the Police Officer in orange at the bottom
Text Color/Opacity/Size
• We can change the text color to help further visually categorize the data
• Since it is a Burglary and thus handled by Law Enforcement we'll shift to a powder blue - in the interest of tradition - and still have a color we can read here on the map
Camera Angles
• We can set these here if we wish to though the easier route is to just make it so the screen shows just what you'd like anyone viewing it to see
• If you want to, for example, highlight the area a burglary happened due to a feature, like a less-visible alleyway, or a poorly-placed hedge that could conceal an intruder
• Zoom the view in with the mouse wheel scrolling or using the camera functions on the right of the screen if you're on a laptop
• Position the view by holding down the mouse button or using the camera functions on the right of the screen if you're on a laptop
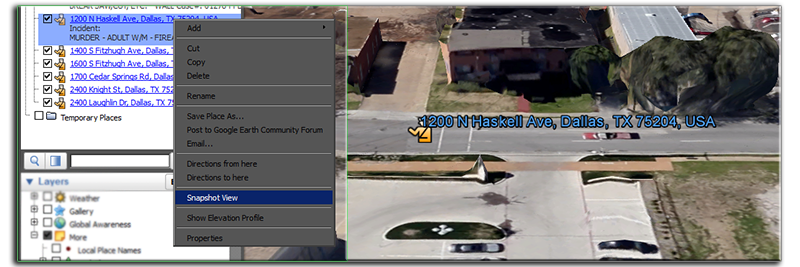
• Right-click the item in the My Places section, then choose Snapshot View in the Menu that drops down
• This will save those settings to the Camera area to make it appear just this way when being double-clicked in the list, or moved to in a tour
I've gone ahead and added 7 items total so we can get a fuller picture.
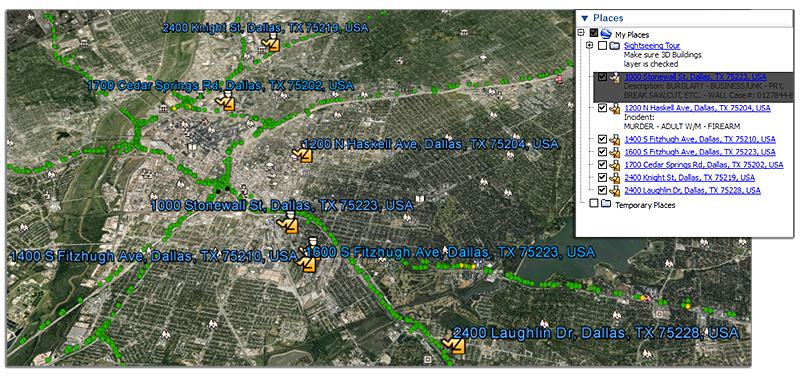
We can now see all items on the map for a detailed view of what happened in the area between those two days with the first 7 items of data. Instead of being done manually we can have any employee handling data directly turn it into a format we can use, which is covered in the advanced help, or in future tutorials.
How about something slightly more advanced to show off your data to someone else, hmm?
• Let's pretend that all 7 actions were committed by the same group of individuals
• Let's say that we knew their route and wanted to follow it for a presentation to other Responders in-house in order to track down the assailants whom have been on the run for some time, causing further mayhem
• Please change the scenario for your own types of incidents or tracking needs
Changing the Order of the Places
• We want to make sure we do everything in order to keep the chronology accurate to the sequence of events
• Go to the left-side bar for our My Places section and then drag each address into the order we want
• First one at the top and the last one at the bottom
• Drag it and then hover it in a spot til you see a small horizontal line where you want it to drop in the list
• It'll drop there when you release the mouse button
• And that's it, it's in the right place, you're done!
• Do File > Save > Save My Places, to save our work (recommended) > Celebrate at your computer that you've done such brilliant work (optional, recommended)
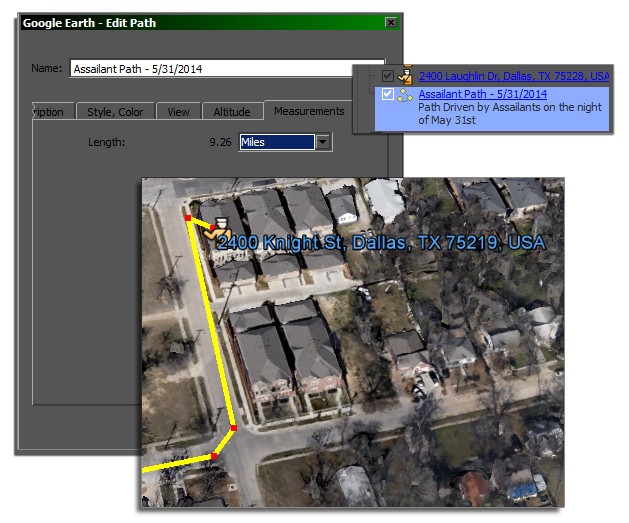
Setting Up a Path
• We'll make a path that these hypothetical assailants drove on the night of the incidents in question to each home or place of business we added earlier
• To simplify things - or perhaps as predictable and witless criminals acting on ruthless, unplanned impulse - their path will be a straight shot to each point in our example with no messing about
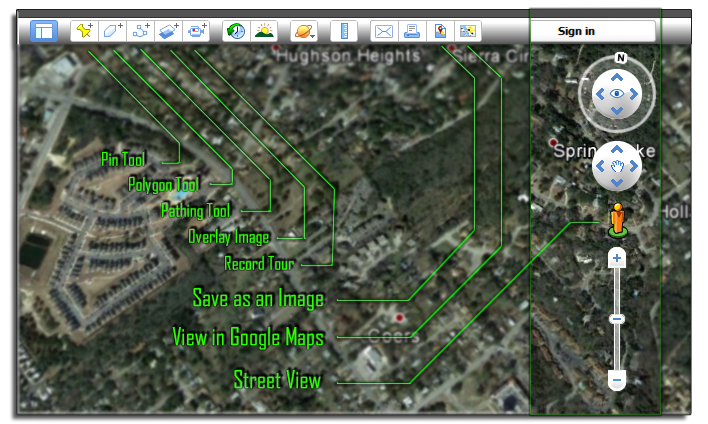
• Click the Add a Path tool at the top of the map window in the left corner
• This will bring up the now familiar properties window that we can add all our information into
• I've added the Burglaries and Homicides committed in the sequence of events here
• Note: Only with the properties window open can we change the points in the path or add/subtract them
• Let's do that by going to our first chosen location in the tour and adding a point at the home
• Simply have the Properties window open, noting that you'll have to use the right side controls to move the Camera now
• Left-click to add
• Right-click to remove the last point
• Click Cancel to clear all changes you've made with the window open
• We will then place a point at every intersection, or otherwise needed segment of the path, they drove/moved through so we can track it accordingly
• You'll want to choose now whether you want a single path to follow that doesn't need stopping, or if you need to stop at each location to give more details on the incident
• If you don't need to stop, make one big path with points from start to finish
• If you need to stop at each point, make a path from one point to the next point you need to stop at
• Then click the Add a Path button for a new one, and repeat creating a new one at each further stop
• We'll see why when we do our tour
• Path Point 1: First home point of entry for Burglary - window, door, garage, etc.?
• Path Point 2: Exit point to Street
• Path Point 3: Street to next intersection
• Path Point 4: Street to next intersection, repeat until next action committed
• For the big path, do this until reaching the final destination.
• Or just make a path from the first point to the second to quickly see it in action
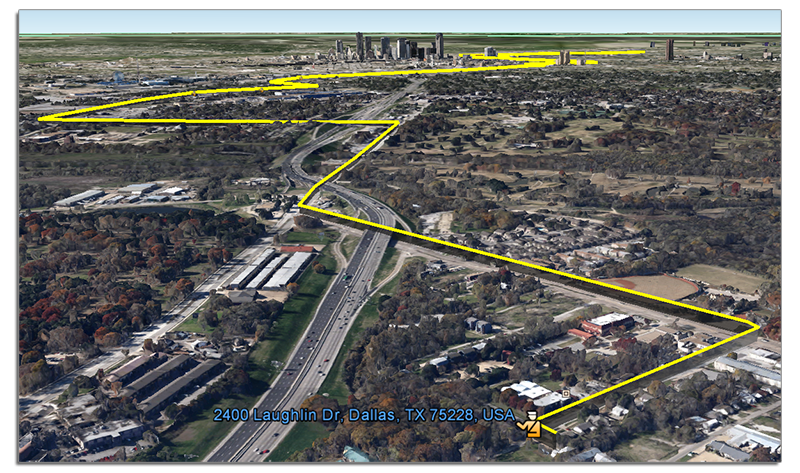
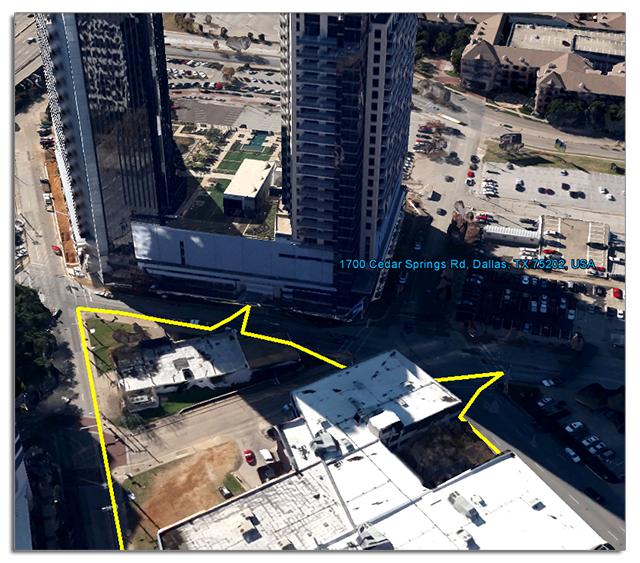
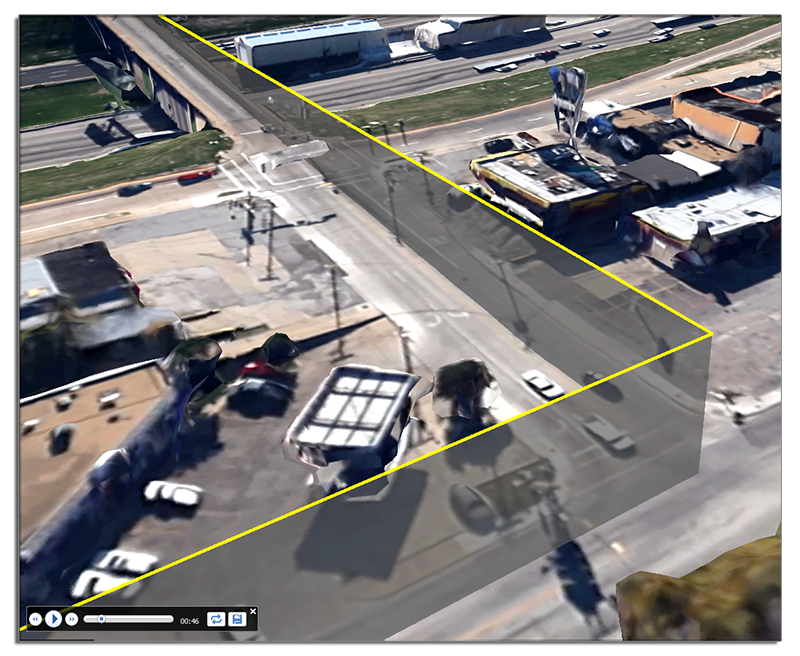
• I've added several 10's of points in the path and now have a complete route from the first location to the next
• Inserted the data for all points into the main path description
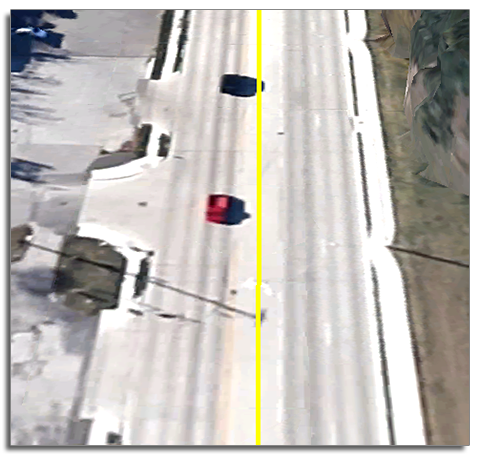
• Changed the Line color of the route to bright yellow
• Changed the width of the line to 5 wide to make sure it was visible in the back of the room while presenting
• Changed the Area color to black
• Changed the dropdown to Filled
• Changed the opacity to 70%
• Moved to the Altitude tab
• Changed Altitude to 14m (meters)
• Changed dropdown to Relative to Ground
• Checked box for Extend to Ground
• All these settings mean high visibility while navigating the path during the presentation that won't limit attendees ability to follow while in larger rooms
• We'll have a bright line, and it will be 3-Dimensional one so it doesn't get lost in the 3D scenery that Google populates
• That can be turned off but it is helpful, despite being unattractive due to being automatically created
• Do File > Save > Save My Places, to save our work
Finalizing Camera Settings for Presentation
We now have all of our points locked down on the path the assailants took.
• Let's make sure we have all the information available to assure they are apprehended
• Drop down to each of your points
• Position the Camera in the view you want to show the entry point, the front of the home, or any other feature or angle of interest
• Right-click the location in "My Places"
• And choose Snapshot View to save the Camera angle
• Do File > Save > Save My Places, to save our work
Building Tours for Presentations or to More Interactively Demonstrate your Data Directly
Now that we have multiple plot points, let's house them all as a tour which will be played like a movie, stopped, started, fast forwarded, rewinded, but otherwise played with the camera angles and path we choose to be best for the demonstration.
• If we simply press the Follow Path button now, which is the button on the right at the bottom of the "My Places" section on the left
• Looks like 3 dots with a line going between them
• Then the camera will follow the path we just set out, not stopping but following the path continuously until it reaches the final point
• If this is sufficient, then you can do just that when presenting
• However, if you setup a tour, you'll be able to click play and have movie controls at the bottom to pause, play, fast forward, rewind, and loop your tour
If you need a bit more out of it:
• We can do things like stop at the locations without you manually pausing it, for example, thus giving you a little time to walkthrough the event we centered on
• We could also make a more precise route with zooming in on specific points, or moving to street view for a real view of the home/area, or turning images/popups on/off at needed times
• Do this by pressing the Record a Tour button in the top left section of the window showing the satellite view
• Once pressed, a small set of controls will come up in the bottom left
• Press record for it to follow all of your actions and camera movements and optionally press the microphone to record audio for a verbal tour, as well
Let's try it out:
• Get into a position near your first point, move the camera up a little bit from the ground
• Zoom out enough that you can see all of your points
• And make sure you are aimed at the final stop, just for aesthetics
• Press record then double-click your first point which will record it moving from the view here, down to the point at which we get to where we positioned the camera
• Give it a couple seconds to hover after it does that then stop recording by pressing the record button again
• It will now play that short segment you recorded so you can see how that performs
Now for the real show:
• I've done both one long path, and a couple small ones so we can see what happens.
• Let's just look at the small path, for ease
• We can get our camera back in position, then click our first path one-time to select it
• Press record
• Then press the small button at the bottom with the 3 circles and a line to follow the path from here
• This will follow the path you set and stop at the next then continue recording
• If this is enough for your presentation, then you can click record to stop recording
• It will then play and show you what you recorded
• If it looks good, press the save disc on the right side to save it
• The properties window will come up again
• Choose a name, add a description if needed, click OK to complete the save - Done!
Maybe that wasn't good enough, though...maybe you want some additional information like a street view to show the house as it actually is, perhaps panning the camera around slightly to show entry points in great detail or to explain more how the intruders were able to gain entry into the home, the core sequence of events, an image overlay showing the plotted scene with evidence markers, etc.
Let's try this again then.
• Get your camera in position to start again
• Press the Record a Tour button, then do the following while it records:
• Double-click your first incident in the My Places area to go there
• We can then hide our path on the left in the My Places area by unchecking it
• This will hide it from the view so we can see the house clearly
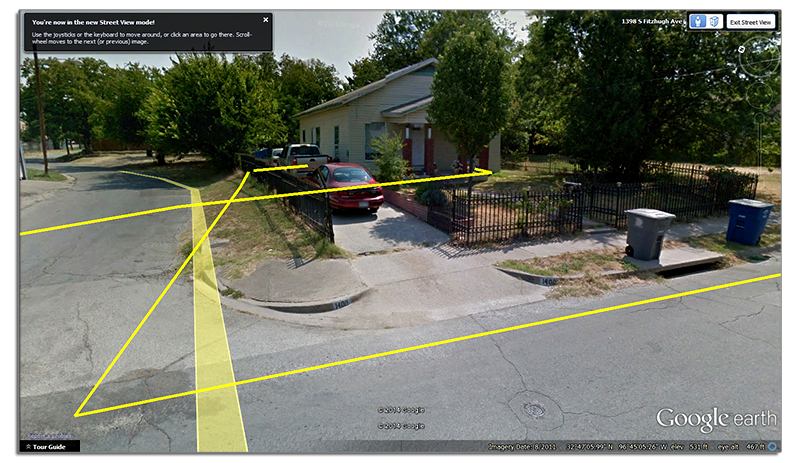
• Hover on the right side where the camera controls are and drag the Orange person onto the street in front of the home
• This takes us to street view while recording
• The street will turn blue where you can drag the person onto it so you know where the Camera will end up
• left-click and drag to pan the Camera
• Press the + above the zoom slider on the right to zoom in, or slide it up/down to zoom in/out
• Roll the mouse wheel to move to the next street view segment in the direction you're pointing
• Note that this could be done to follow your entire path manually or automatically in the street view as well
• When done elaborating on the actual location, double-click your first point again to leave this view and view it again in non-street view
• If Google Earth has an issue, it sometimes sends you out into space a little, just double-click the location again to have it fix itself
• Now that we showed the first location, while still recording, we can click our Path in My Places that we made
• Click the button with the 3 circles and the line to follow the path and let it drive us to Point 2
• We can then pan the camera around, speaking of assailant movements, where they parked their car, or go into street view here to elaborate again with a specific visual
• When complete on your second location's explanation, you can double-click your next location in My Places to be sent back to centering the camera as you had it
• Wait a couple seconds for aesthetic
• Then press the record button to stop recording
Now it will play and show you - if you followed the same method:
• Your camera coming down from the start to your first point
• A couple seconds wait, your path disappearing so we can see the house
• Moving into street view and any camera pans or zooms you did
• Popping out of the street view into the normal view
• Following the path to location 2
• Any further camera pans, zooms, street views, etc. that you did
• And finally a return to the camera view of the second location
• Same for any other points you went to
• A couple seconds for aesthetic and it's over
Congratulations, you have a short tour to show off or use for presentations.
• You can also click at the very top of the window just above the terrain viewing area on the button that says Save as an Image
• This will save an image of what you're currently looking at so you can print it out or give it to others
• Or there is the View in Maps button to view it in 2-dimensions
• Note that you will have to have signed in to your Google Account and saved it to your places to see it shown here
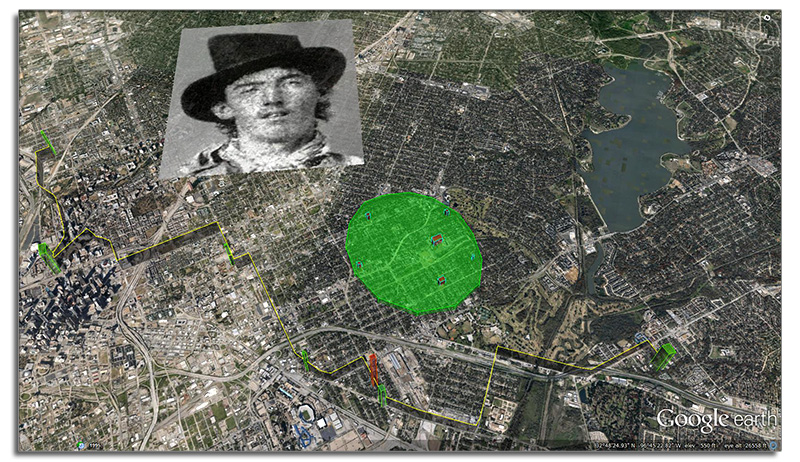
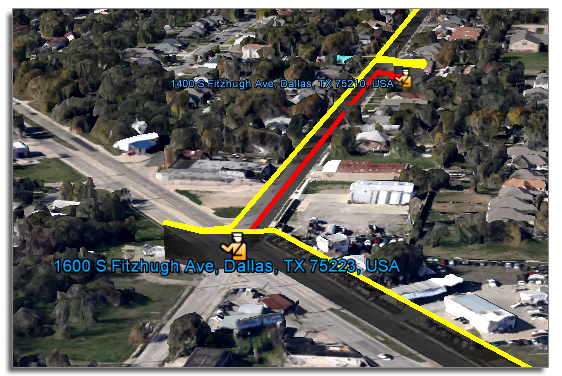
More Advanced Help on Functions Like Tours
Below is a demonstration of a very slightly more advanced use of the same content that includes polygon usage to indicate reports that came in with locations of the suspects which we then dropped a circular polygon around to indicate a likely search area to catch them. Further, we added in an image overlay to show the face of the suspected ringleader to even further enhance the use of the map: